

- Bitcoin price plunged 9% to $83,810 as U.S. spot Bitcoin ETFs saw their second-largest single-day outflow in history, triggering the longest U.S. selling streak of the cycle.
- Fair value gaps have now been filled, funding rates are deeply negative, and sentiment is in “extreme fear”, conditions that have historically preceded strong mean-reversion rallies.
- The current 32% drawdown mirrors past bull-market flushes, with many traders now watching for bullish divergences and a higher low to confirm the next rebound.
Bitcoin price has dropped 9% in the last 24 hours to trade at $83,810 as of 1:21 a.m EST on a 23% surge in trading volume to $102 billion. BTC is down more than 32% from its mid-October all-time high of around $109,000.
Bitcoin Spot ETFs Suffer Second-Worst Outflow Ever – $903M Gone in a Day
The sharp drop came alongside the second-largest single-day outflow ever recorded from U.S. spot Bitcoin ETFs: $903 million left the funds on November 20, according to SoSoValue data.
Ethereum ETFs lost another $262 million, extending an eight-day outflow streak, while Solana ETFs were the lone bright spot with $23.66 million in fresh inflows.
The sell-off pushed the Coinbase Bitcoin Premium Index (a measure of how much U.S. investors are willing to pay above the global spot price) into negative territory for the 21st straight day, the longest stretch of U.S.-based selling pressure in this cycle.
Yet many veteran traders, such as MD Trad,e are refusing to call this the start of a new bear market, holding the opinion that we still haven’t seen a confirmed impulsive decline.
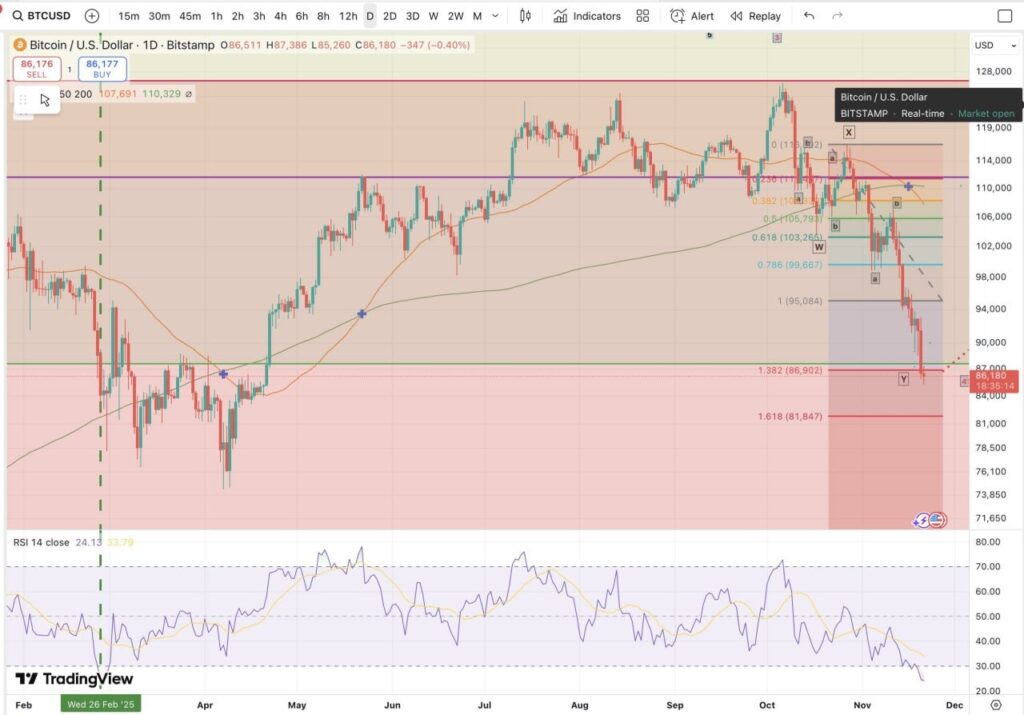
MD Trade says that for a confirmed downward trend, the price would need to reach at least the 1.618 Fibonacci extension of the first wave down, and we’re not there yet. At $83.8K, the BTC price is less than $3,000 from that mark.
Fair Value Gap Filled – History Says the Next Move Is Usually Up
Despite the overwhelming bearish sentiment in the market, history appears to back the calmer voices. Every 30%+ drawdown during Bitcoin’s broader bull markets has eventually led to strong mean-reversion bounces and new highs.
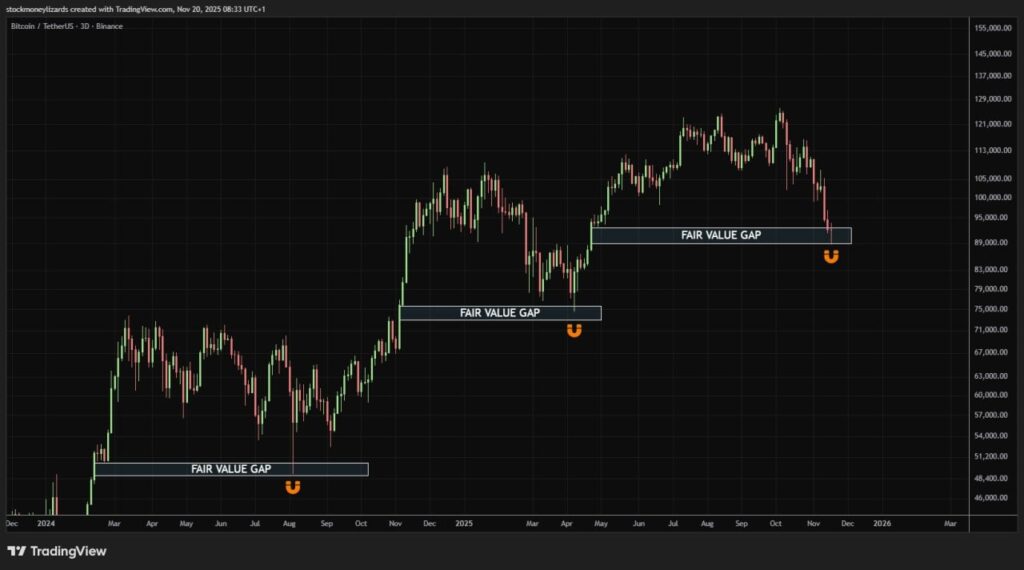
The current decline has also carried Bitcoin straight into a large “fair value gap”, an area on the chart left unfilled from previous rapid upward moves. These gaps have been filled in 2024 and again in early 2025, each time followed by sharp rallies, according to analyst Stock Money Lizards.
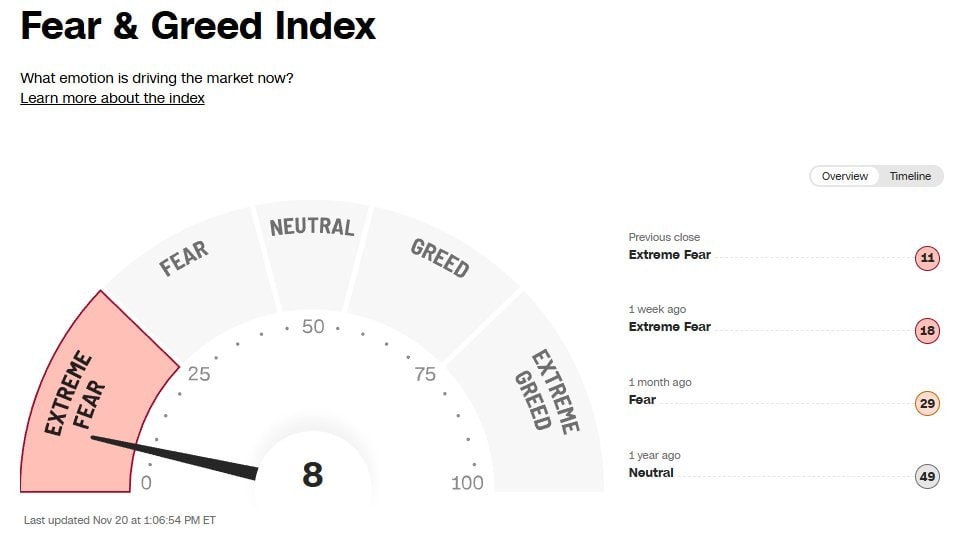
Extreme Fear, Exhausted Sellers Show Classic Bottom Signals
Sentiment indicators are flashing extreme pessimism. Funding rates are deeply negative, retail search interest has collapsed, and fear-and-greed indexes sit in the single digits. Statistically, these conditions have marked local bottoms far more often than the start of deeper crashes.
Macro uncertainty is adding fuel to the volatility. Markets are digesting a new Trump administration, shifting interest-rate expectations, and the revelation that the Federal Reserve will once again enter its December policy meeting without the latest jobs report — the November employment data won’t be released until December 16, six days after the Fed decision.
For now, traders are watching a handful of technical signals that have reliably preceded reversals: bullish divergences on RSI, shrinking volume on down candles, and any sign of a higher low on daily or three-day timeframes.
From “How Low?” to “When’s the Bounce?”
The big-picture question remains unchanged: Bitcoin is still inside a multi-year bull market that began in 2022. The current 32% drop, while painful, is smaller than the 38–45% corrections seen in 2021 and well within historical norms.
In the words circulating heavily in trading circles this week: the time to be aggressively bearish was four weeks ago. Right now, many are asking not “how low can it go,” but “when does the bounce start?”
Disclaimer: The facts and analysis presented here are only for informational purposes. Readers should not interpret the content of this article as financial advice or product recommendations.
What’s your Reaction?
+1
0

+1
0

+1
0

+1
0
+1
0

+1
0

+1
1