
- The Federal Reserve delivered its third 25 bps rate cut of 2025, boosting liquidity and setting the stage for renewed interest in crypto assets.
- Spot Ethereum ETFs absorbed $57.58 million in one day, led by BlackRock’s ETHA with $56.45 million, pushing cumulative inflows above $13.2 billion.
- BTC’s volatility cycle has cooled, with charts hinting at a potential bear flag targeting 80K even as Fed easing tempts dip buyers.
The U.S. Federal Reserve has cut interest rates by 25 basis points, marking its third reduction of 2025. Announced on December 11, this decision aims to stimulate economic growth amid lingering inflation concerns. Lower rates often encourage investment in riskier assets like cryptocurrencies, potentially fueling renewed interest in digital currencies.
Ethereum ETFs Attract Fresh Capital
Spot Ethereum ETFs are showing investor confidence following the Fed’s announcement. According to data from SoSoValue, these ETFs recorded a total net inflow of $57.58 million on December 10 (Eastern Standard Time). This surge highlights growing institutional appetite for Ethereum exposure.
Leading the pack was BlackRock’s ETHA ETF, which saw a single-day net inflow of $56.45 million. This pushes ETHA’s cumulative historical net inflows to an impressive $13.207 billion, underscoring BlackRock’s dominance in the crypto ETF space. The fund’s performance reflects broader market optimism, as lower interest rates make borrowing cheaper and could drive more capital into blockchain-based assets.
Not far behind, Grayscale’s Ethereum Mini Trust ETF (ETH) posted a $7.91 million net inflow for the day. While smaller in scale, this adds to the positive momentum for Ethereum products. Overall, total net assets for spot Ethereum ETFs now stand at $21.43 billion, with Ethereum’s price hovering around $3,355.44.
The chart from SoSoValue illustrates this trend, showing steady green bars for inflows over recent months, interspersed with minor red outflows, against a backdrop of rising blue asset value lines.
Bitcoin Faces Volatility Cycle and Bearish Patterns
Meanwhile, Bitcoin is navigating a period of declining volatility, a pattern that traders know all too well. Volatility in BTCUSD is cyclical—high swings often give way to calmer periods, and vice versa. Current charts suggest this low-volatility phase might be part of a counter-trend move following a drop from a broadening top pattern.
Technical analysis points to a potential bear flag formation, which could signal further downside if confirmed. The BTCUSD daily chart from Bitstamp shows price action consolidating after a sharp rally to around 100K, with a highlighted bear flag targeting 80K.
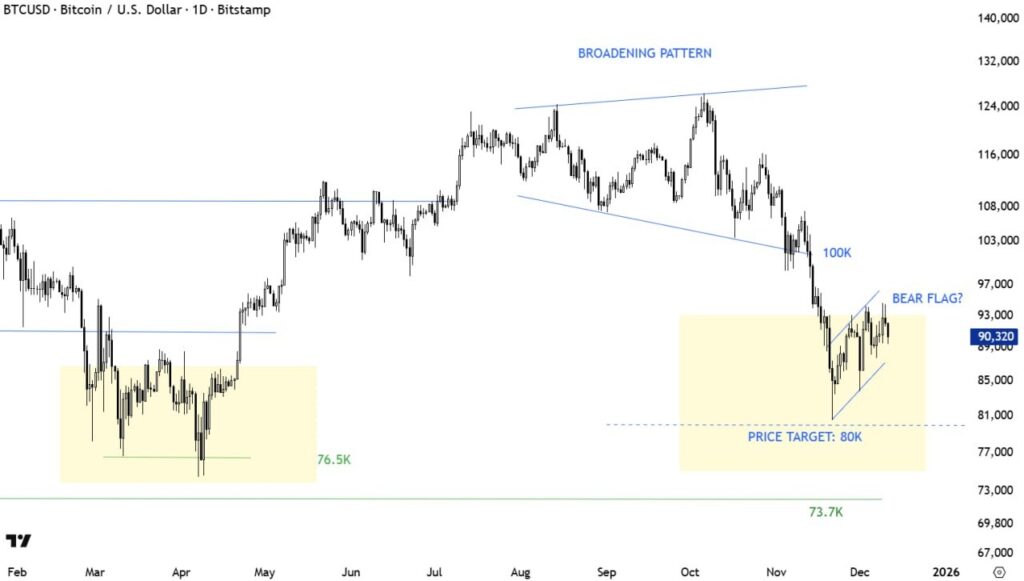
Support levels are noted at 76.5K and 73.7K, while the broadening pattern earlier in the year led to a peak before the recent pullback. As of December 11, Bitcoin is searching for a bottom, with traders watching for breaks below key lines that could accelerate selling.
This comes at a time when the Fed’s rate cuts might provide a cushion, encouraging dip-buying. However, if the bear flag plays out, Bitcoin could test lower thresholds before stabilizing.
Market Outlook Remains Cautious Optimism
The interplay between macroeconomic policy and crypto dynamics is evident here. With Ethereum ETFs drawing inflows and Bitcoin in a consolidation phase, investors are balancing Fed-driven hope against technical risks. As 2025 winds down, watch for how these trends evolve. Rate cuts could spark a year-end rally, but volatility’s return remains a wildcard.
What’s your Reaction?
+1
0

+1
0

+1
0

+1
0

+1
0

+1
0

+1
0