

- The Bitcoin market is undergoing a downward correction triggered by technical structural breaks (no new highs, falling below old lows).
- The movement is being amplified by the liquidation of leveraged positions, while market sentiment is characterized by uncertainty and fear.
- A sustained trend reversal first requires a bottoming phase (prolonged sideways movement) in the identified support zones.
Current Market Phase and Structural Break
The Bitcoin market is in a pronounced downward movement, which was initiated by several technical structural changes. After a prolonged upward phase, clear signs of a trend reversal pattern have formed in the chart. Such a structural break is typically characterized by a lack of new highs, while at the same time striking lows are being undershot. This development signals that the previously dominant demand has subsided and that sellers have temporarily taken control.
Bitcoin price (Image: Tradingview)
The decline was further exacerbated by a phase of weaker market strength. Several indicators, including volume momentum and short-term trend comparisons, show that the previous upward trend had lost momentum. This led Bitcoin to enter a correction zone, the depth of which has now become clearly visible.
Related article: Bitcoin crash: Is this the beginning of a total crash or the last big chance?
Psychology and Market Sentiment
Parallel to the technical development, market sentiment has fallen into a state of pronounced uncertainty. Sentiment barometers that measure fear and confidence in the market often show extreme readings in such phases. These arise when a large proportion of market participants act cautiously or nervously after rapid price corrections.
In the past, periods of extreme fear have sometimes led to interesting turning points, but their significance always depends on the overall structure of the market. In an intact upward phase, such signals can indicate recoveries. In a downward phase that has already begun, on the other hand, they tend to reflect the nervousness of a market that is trying to regain a balance between supply and demand.
Liquidations as a Driving Force
A key factor in recent price movements is the liquidation zones. These arise in highly leveraged markets where many market participants open positions with borrowed capital. When a certain price range is reached in which large quantities of such positions are automatically closed, abrupt price movements occur.
In the current market phase, considerable liquidity is concentrated above the most recent price level, while there are several zones in the lower price range where further automatic sales can be triggered. This mechanism can lead to rapid downward movements when the market approaches these areas.
Liquidation charts that visualize such price clusters indicate that several relevant zones have already been reached and that further areas below are active. This confirms that the current correction is technically understandable and not driven exclusively by fundamental news.
Possible Price Targets for the Current Correction
From a technical perspective, several price regions can be identified in which important market reactions have occurred in the past. The first zone is located immediately below the most recent correction lows. A deeper area is located around previous all-time highs, which often act as long-term support in major trend cycles.
Particularly relevant is the area between the old all-time high and the zone above it, where large trading volumes were seen in the past. This is where the highest-volume price range of the previous sideways market is located. Historically, markets often stabilize at such points because many market participants have built up long-term positions there.
Although a stronger sell-off into lower regions would be theoretically possible, it is considered less likely based on the currently known structure, provided there is no external shock.
The Importance of a Bottoming Phase
A sustained trend reversal usually requires a bottoming phase. This often manifests itself in extended sideways movement, with the market making several attempts to stabilize. During such phases, small upward impulses reappear, but remain limited at first. At the same time, selling pressure gradually decreases.
For the current market situation, this means that a sideways movement in the lower price region would be a typical pattern. Only when buyers are willing to take on greater risk and selling interest weakens at the same time will a sustainable turning point emerge.
Such bottoming phases not only serve to stabilize prices, but are also psychosocially relevant: market participants can organize their emotions, realign strategies, and make decisions without acute panic or euphoria.
Interactions with Traditional Markets
The development of the Bitcoin market does not occur in isolation. At the same time, movements in traditional financial markets influence events. A rising US dollar index, for example, can put pressure on risk assets as it changes the global liquidity situation. Stock indices such as the S&P 500 also often show simultaneous changes in direction, indicating a shift in investor expectations.
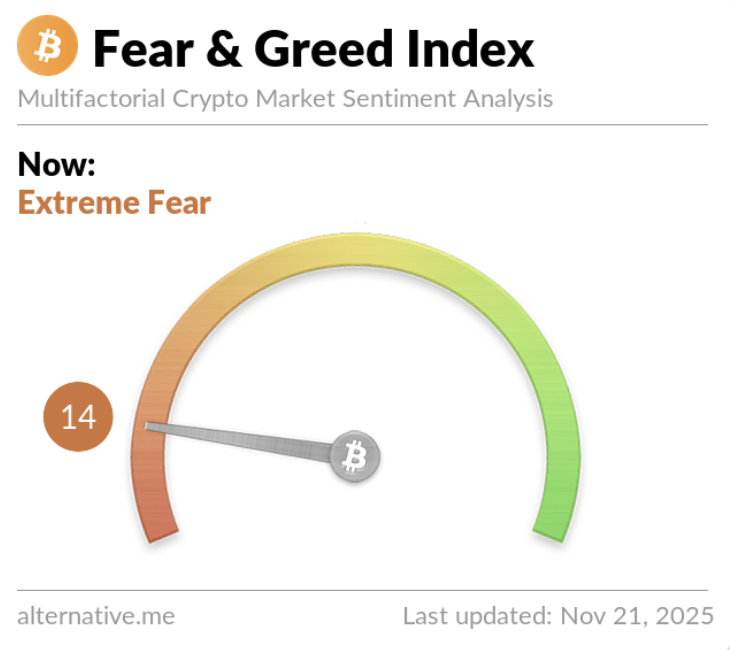
Bitcoin Fear and Greed Index (Source: Alternative.me)
When traditional markets enter a phase of higher uncertainty, risky asset classes such as cryptocurrencies tend to decline in the short term. Conversely, a recovery in the leading international markets can pave the way for new momentum in digital assets.
Altcoins in the Wake of the Bitcoin Correction
Altcoins often react more strongly to market changes than Bitcoin itself. Many projects have already been in a pronounced downward trend for several weeks. The reason for this is that cryptocurrencies with lower market volume are more sensitive to falling demand. In addition, larger sell-offs in Bitcoin often withdraw capital from other segments, which encourages additional distortions.
Nevertheless, some altcoins are in attractive long-term zones that have emerged from comprehensive correction movements. Historically, such phases tend to enable subsequent upward movements as soon as market sentiment improves again. However, this remains contingent on clear stabilization in the Bitcoin market.
Summary of the Market Situation
The market is currently in a technically explainable correction phase, characterized by a combination of structural breaks, liquidation zones, psychological uncertainty, and global capital market movements. The downward movements have reached several potential support zones, while underlying areas remain active and must be monitored.
In the medium term, it will be crucial to see whether a bottoming phase develops in these zones. Only such stabilization will form the basis for a sustainable return to a constructive market phase.
What’s your Reaction?
+1
0

+1
0

+1
0

+1
0

+1
0

+1
0

+1
0